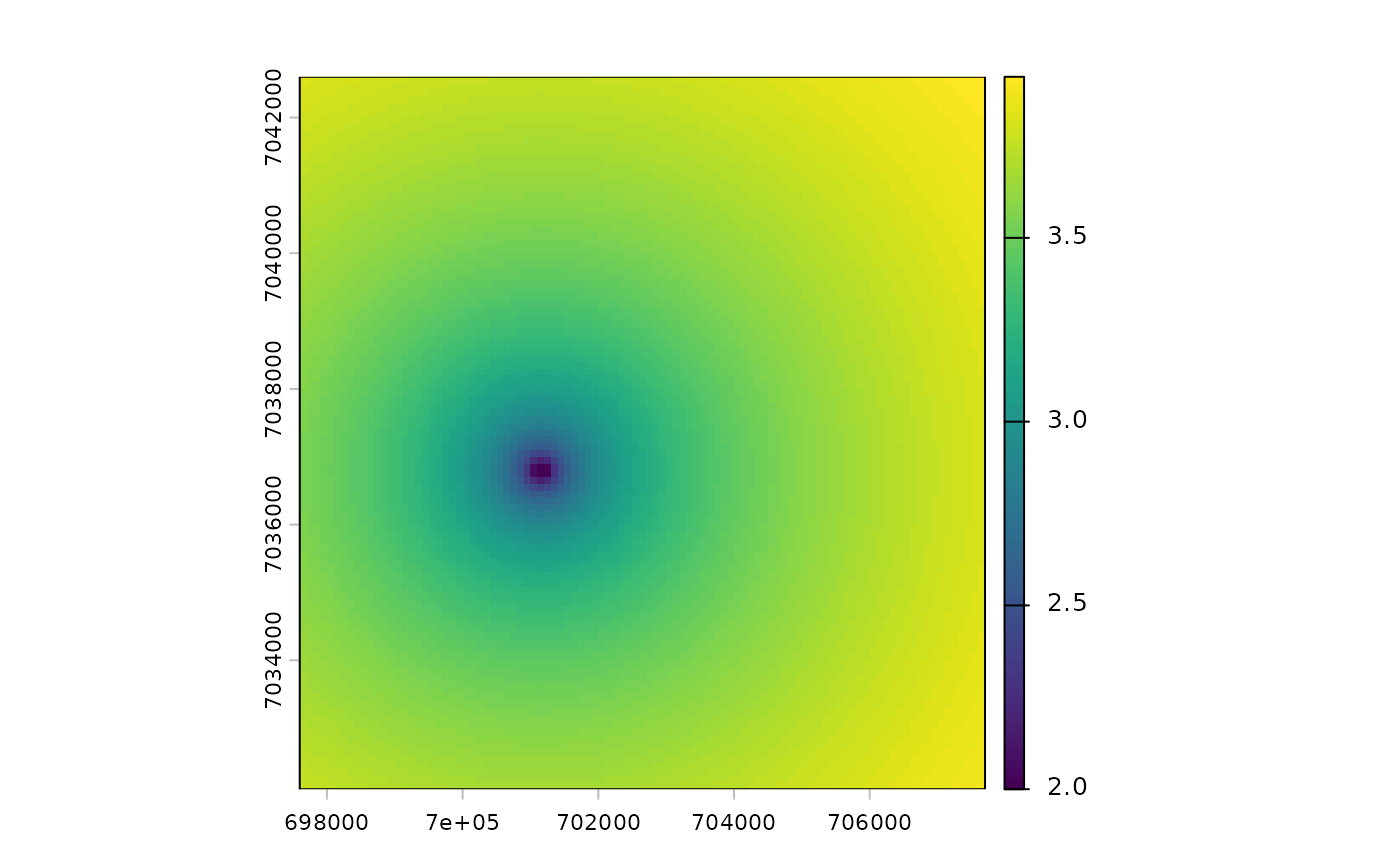
Distance and wind covariates around a contamination source
Source:R/soil_interpolation.R
source_covariates.RdBuilds covariate rasters describing the position of every cell relative to a point source of contamination (e.g. a smelter chimney). They can be used as external drift in [krige_soil()]:
- `log10_dist`
the log10 of the distance (m) to the nearest source. Atmospheric deposition typically decreases as a power law of the distance, i.e. linearly in log-log scale.
- `wind`
(only if `wind_rose` is given) the frequency of the wind sector in which the cell lies, seen from the source. Cells lying downwind of the dominant winds receive more deposition.
Arguments
- template
A `SpatRaster` defining the grid.
- source
An `sf` / `sfc` POINT object: location(s) of the source(s). Must be a single point when `wind_rose` is used.
- wind_rose
Optional `data.frame` with columns `direction` (centre of the sector, in degrees clockwise from the North, as seen from the source) and `freq` (wind frequency, any unit). Each cell gets the `freq` of the closest sector direction.
- min_dist
Numeric. Distances below this value are set to `min_dist` (avoids `log10(0)` at the source). Default: the cell size.