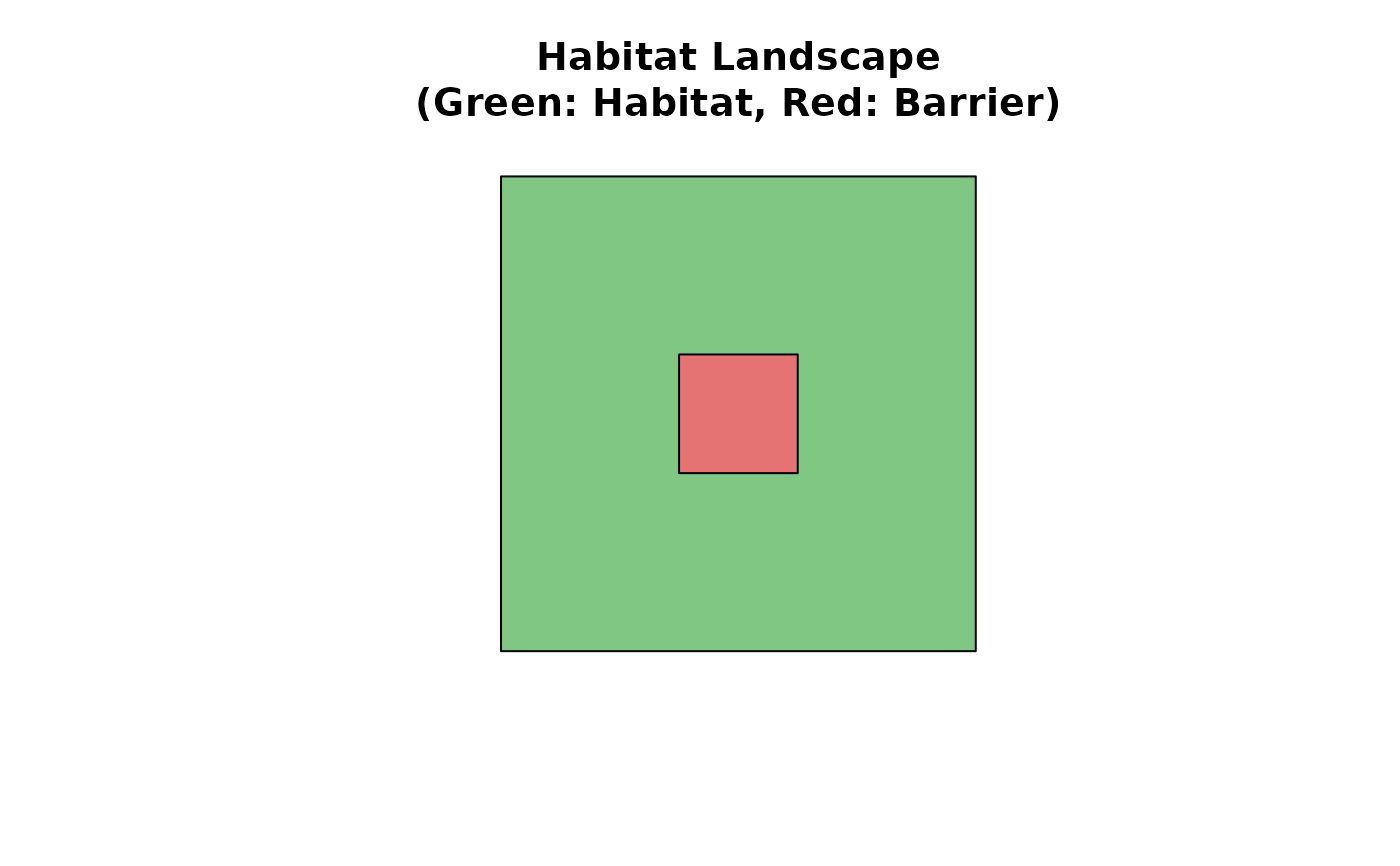
Visually inspect a habitat object. Favorable habitat zones are colored
in green, and absolute barriers (non-habitat) are colored in red.
Usage
# S3 method for class 'habitat'
plot(x, ...)Examples
library(sf)
square <- function(a, b) st_polygon(list(cbind(c(a, b, b, a, a), c(a, a, b, b, a))))
good_polygons <- st_sf(geometry = st_sfc(square(1, 9)))
roads <- st_sf(geometry = st_sfc(square(4, 6)))
hab <- habitat() |>
  add_habitat(good_polygons, weight = 1) |>
  add_nohabitat(roads)
plot(hab)