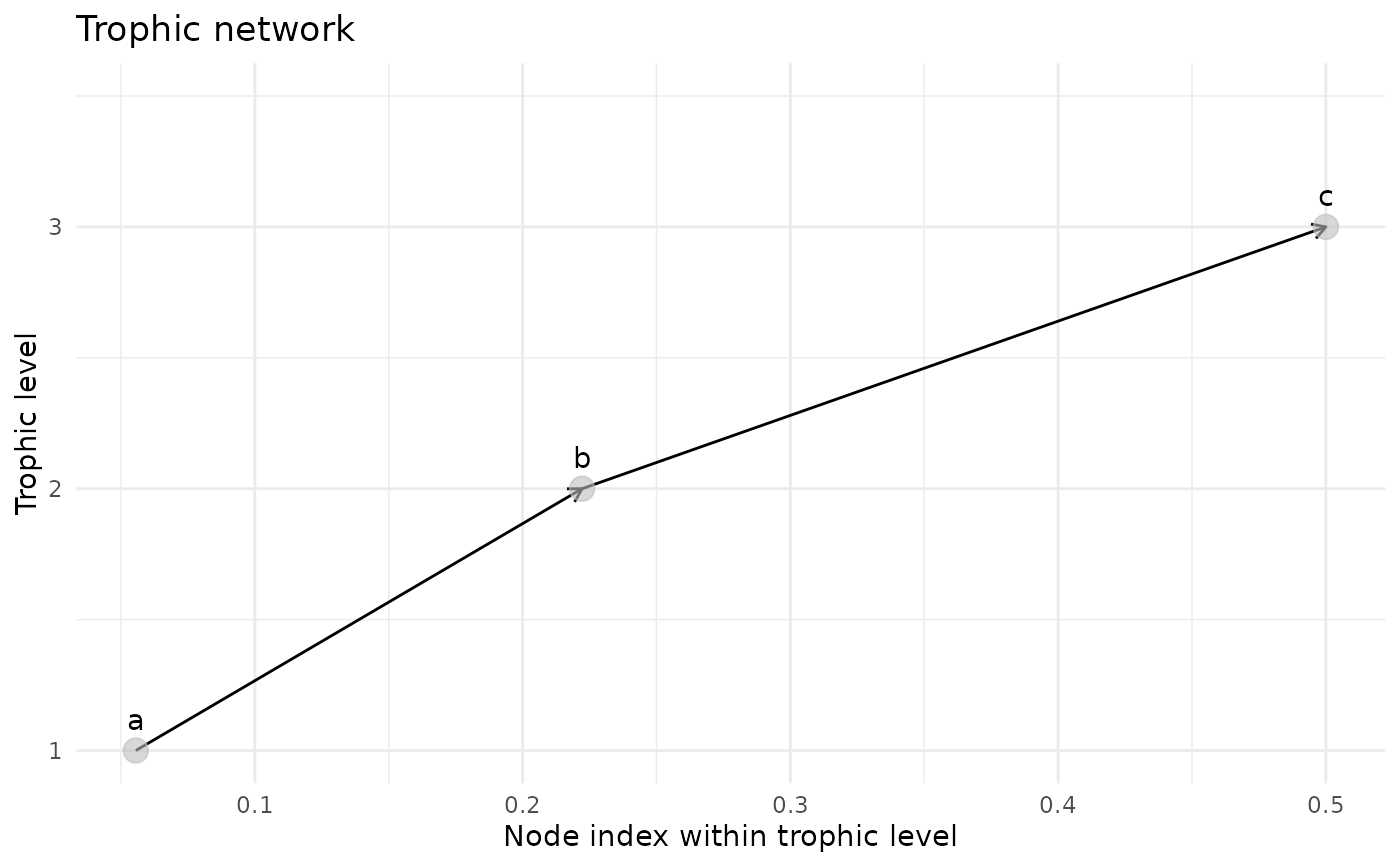
Plot a trophic table
plot.trophic_tbl.RdCreates a simple graphical representation of a trophic network using ggplot2.
Arguments
- x
A
trophic_tblobject.- shift
To shift x_axis between trophic level and avoid the potential overlapping of arrows.
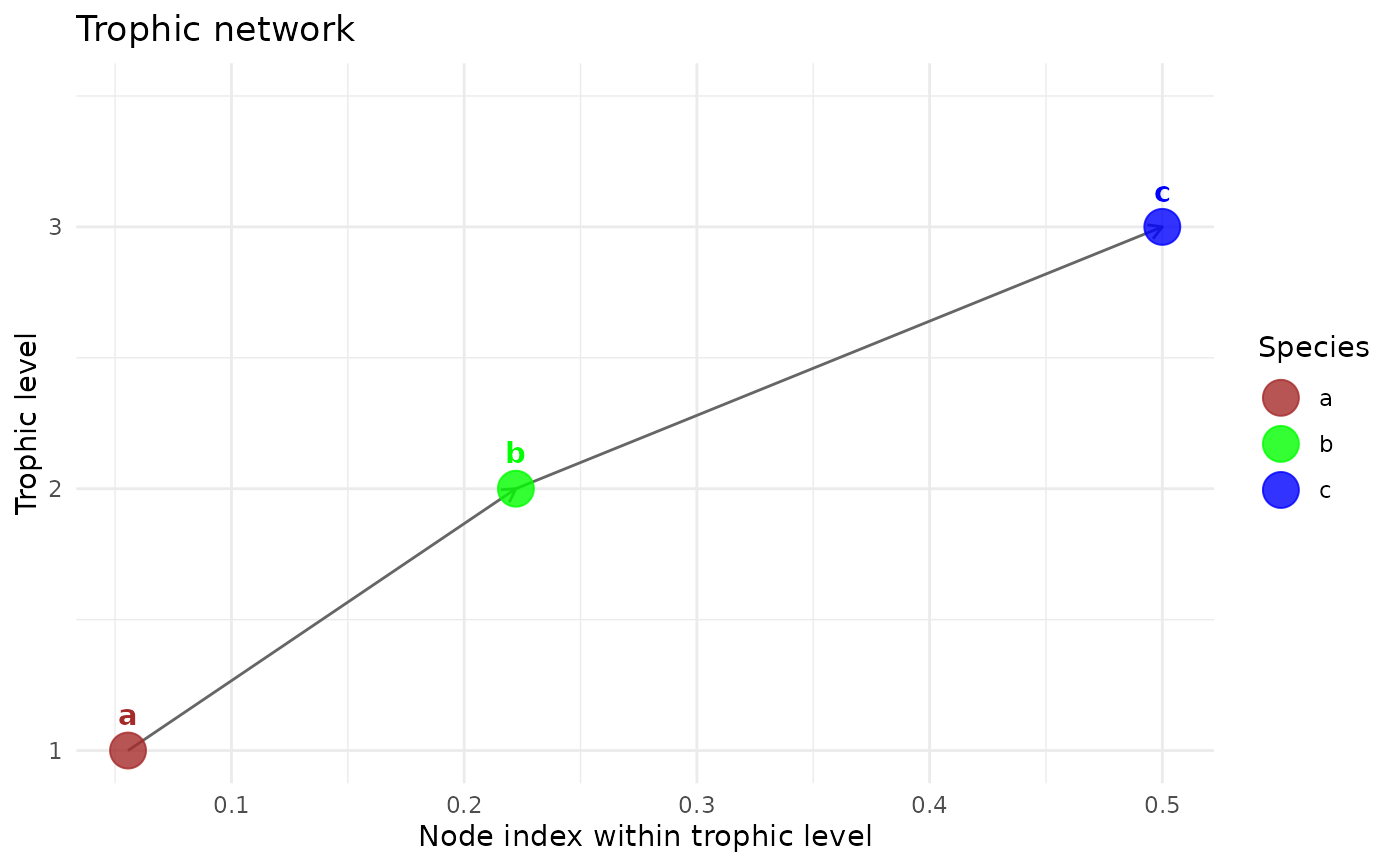
- colors
A named character vector of colors (hexadecimal or standard R color names) where the names match the node names in the trophic table. If NULL, default ggplot2 colors are used.
- edge_width
A character string indicating how to scale the width of the arrows. Must be one of "none" (default), "raw" (uses the raw weights), "norm_target" (normalizes weights to sum to 1 for each target/to node), or "norm_source" (normalizes weights to sum to 1 for each source/from node).
- ...
Additional arguments (not used, for S3 consistency).